

Part I — The Science of Seeing: How Does Attention Work?
Imagine looking at a crowded classroom. There are people talking, bags scattered around, books on desks, and movement everywhere. Despite all this visual information, you can usually identify a particular object almost immediately.
Now imagine someone asks you to find a red circle among twenty blue circles. You would probably locate it quite quickly.
But what if you had to find a red circle among red squares and blue circles?
Suddenly, the task becomes more complicated.
Although both tasks involve identifying a visual target, they place different demands on the human attentional system. This difference is at the heart of one of cognitive psychology’s most influential theories: Feature Integration Theory (FIT), proposed by psychologist Anne Treisman and Garry Gelade in 1980.
The theory explores how the brain processes individual visual features and combines them to create our perception of complete objects.
To understand this, we first need to consider how visual information is processed.
When we look at an object, we don’t simply register it as one indivisible image. Its visual properties include colour, shape, orientation, size, and position. These properties provide different kinds of information that contribute to our perception.
For example, when looking at a red circle, our visual system processes information about its redness and circular shape. Feature Integration Theory proposes that basic visual features can be registered relatively independently during an early stage of perception. However, combining these separate features into a coherent object requires focused attention.
This distinction helps explain two different kinds of visual search.
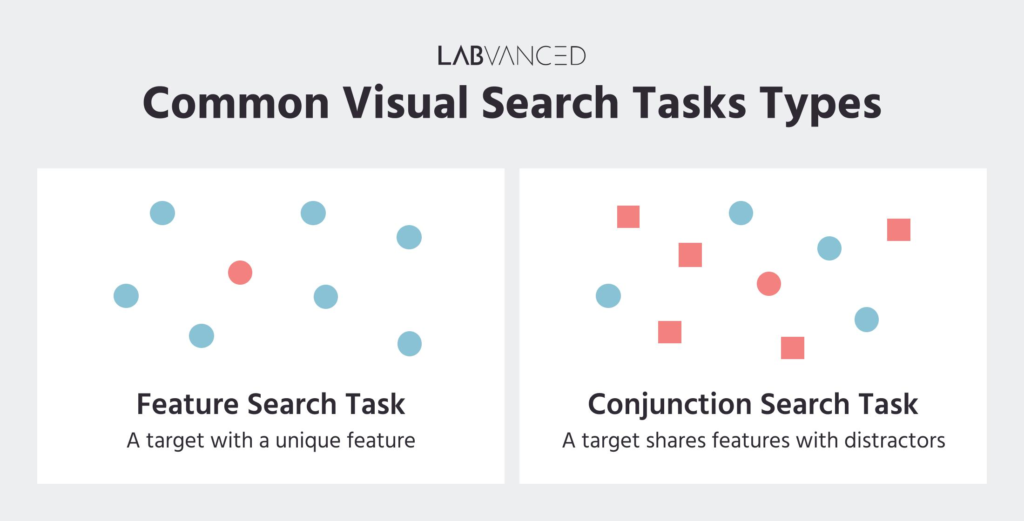
What it illustrates: The difference between finding an object based on one feature (colour) and finding an object based on a combination of features (colour + shape).
1. Feature Search
A feature search involves identifying a target using one distinctive visual characteristic.
For example:
- One red circle among several blue circles.
- One vertical line among horizontal lines.
- One large object among smaller objects.
The target differs from the distractors in a single feature. According to Feature Integration Theory, such targets can often be detected rapidly because the distinguishing feature stands out from its surroundings.
This phenomenon is commonly described as the pop-out effect.
2. Conjunction Search
A conjunction search requires identifying an object using a combination of two or more features.
For example:
- One red circle among red squares and blue circles.
- One green vertical line among green horizontal lines and red vertical lines.
Here, neither colour nor shape alone identifies the target. The observer must identify the correct combination of features.
Feature Integration Theory proposes that this process requires more focused attention, potentially involving the examination of individual items.
This creates an important prediction: conjunction searches should generally become slower as the number of objects increases, whereas feature searches should be less affected by the number of distractors.
The original Treisman and Gelade research investigated these differences through controlled visual-search experiments. Their findings provided important evidence for the role of attention in combining visual features.
But how can we measure something as subjective as attention?
One way is through reaction time.
Instead of asking participants whether a task felt difficult, we can measure how many milliseconds they take to identify a target. By comparing reaction times across different visual-search conditions, we can investigate how the complexity of a visual display influences perception.
This turns an everyday experience into something measurable.
And that is where psychophysics becomes particularly interesting.
Psychophysics is the scientific study of the relationship between physical stimuli and the sensations or perceptions they produce. It allows researchers to investigate how people detect, distinguish, and respond to information presented through their senses.
In this project, the focus is visual perception: understanding how the complexity of a visual environment influences the speed and accuracy of attention.
Part II — Bringing the Laboratory to the Browser
Traditionally, psychophysics experiments have been conducted in controlled laboratory environments. Researchers present carefully designed stimuli on a screen and record participants’ responses using specialised equipment.
However, web technologies have made it possible to conduct many behavioural experiments directly through a browser.
This creates an interesting opportunity: Can we recreate a visual-search experiment online and use it to investigate human attention?
The proposed experiment, titled Measuring Visual Search Efficiency, would use JavaScript and the open-source library jsPsych to create an interactive visual-search task.
jsPsych is designed specifically for building behavioural experiments in web browsers. It provides tools for presenting visual stimuli, recording keyboard responses, and measuring reaction times.
Rather than simply displaying images, the experiment would generate controlled visual displays and record how participants respond to them.
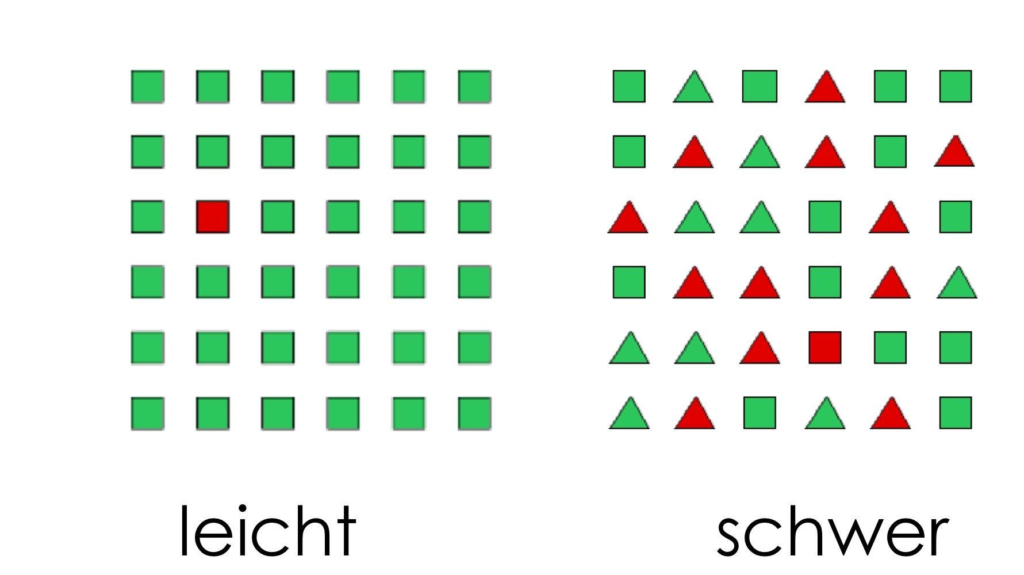
Example of a browser-based visual-search task designed to measure participants’ reaction times and accuracy.
Designing the experiment
The experiment would contain two main conditions:
Condition A — Feature Search
Participants would be shown several blue circles and asked to identify a red circle.
The target would differ from the distractors in colour.
Condition B — Conjunction Search
Participants would be shown a combination of red squares and blue circles and asked to identify a red circle.
The target would now require participants to identify a combination of colour and shape.
Participants would respond using designated keyboard keys, indicating whether the target was present or absent.
To investigate the influence of visual complexity, each condition would include different display sizes.
For example:
- 4 objects
- 8 objects
- 16 objects
- 24 objects
The number of objects displayed is known as set size.
By increasing set size, we can investigate whether adding more distractors changes the time required to locate the target.
An important aspect of the experiment would be controlling other variables. Target position, object spacing, display duration, stimulus size, and the proportion of target-present and target-absent trials should be managed consistently.
The order of trials should also be randomised to reduce the possibility that participants simply memorise a predictable sequence.
Collecting reaction-time data
Every time a participant responds, the experiment can record their reaction time in milliseconds.
For example, a hypothetical dataset might look like this:
| Participant | Search condition | Set size | Reaction time |
|---|---|---|---|
| P01 | Feature | 4 | 420 ms |
| P01 | Feature | 16 | 435 ms |
| P01 | Conjunction | 4 | 510 ms |
| P01 | Conjunction | 16 | 760 ms |
These are illustrative values, not actual experimental findings.
Over multiple trials, this creates a dataset that can be analysed statistically.
The experiment should record accuracy alongside reaction time because responding quickly does not necessarily mean identifying the target correctly.
Incorrect responses should not simply be treated as evidence of faster perception.
Building the experiment
There are two particularly useful tools for this project.
jsPsych (JavaScript) would allow the experiment to run directly in a browser. Its plugins can display stimuli, collect keyboard responses, and record reaction times.
Alternatively, PsychoPy offers a Python-based environment for designing psychological experiments. Its online platform, Pavlovia, can be used to run compatible experiments through a browser.
For a web-based project, jsPsych is a particularly natural starting point because it integrates directly with browser technologies.
The experiment would follow a simple sequence:
- Display an introduction explaining the task.
- Present practice trials so participants understand the instructions.
- Display randomly generated visual-search trials.
- Record responses and reaction times.
- Save anonymised experimental data.
- Analyse the collected observations.
Before collecting real data, the experiment should be tested repeatedly to ensure that stimuli display correctly, responses are recorded accurately, and the task works across supported browsers.
A note on online experimentation
Browser-based experiments are convenient, but they introduce methodological challenges.
Participants may use different computers, keyboards, screen sizes, browsers, and operating systems. These differences can influence reaction-time measurements.
Research by Anwyl-Irvine and colleagues (2021) investigated the timing accuracy of several online experiment platforms and demonstrated why researchers must consider hardware and software differences when interpreting reaction-time data.
For this reason, participants should ideally use computers with physical keyboards, and the device and browser information relevant to timing should be documented without collecting unnecessary identifying information.
Most importantly, the experiment should be treated as an exploratory study rather than a perfect laboratory replication.
Part III — Turning Human Responses into Scientific Evidence
Collecting reaction times is only the beginning.
The more interesting question is what those measurements can tell us about visual perception.
Once the experiment has been completed, the collected data can be organised and analysed using Python’s scientific libraries, particularly SciPy, NumPy, Pandas, and Matplotlib.
The primary research question would be:
Does conjunction search produce significantly longer reaction times than feature search, and does increasing the number of visual objects affect the two conditions differently?
This question can be investigated through several stages of statistical analysis.
1. Cleaning the data
Before analysing the results, the dataset needs to be checked.
Incorrect responses should be separated from correct responses, and unusually fast or slow responses should be investigated using predefined exclusion criteria.
For example, a participant who accidentally presses a key before properly viewing the display should not be treated as having identified the target instantly.
Reaction times should be summarised using appropriate measures, such as the mean or median, depending on the distribution of the observations.
Accuracy should also be examined independently.
2. Comparing reaction times
The first comparison would involve calculating the average reaction time for feature searches and conjunction searches.
If the experiment follows the theoretical predictions, conjunction searches should generally produce longer reaction times.
However, the relationship between reaction time and set size is particularly important.
A feature search may show a relatively shallow increase in reaction time as more objects are added.
A conjunction search may show a steeper increase because identifying the correct combination of features requires more attentional processing.
This relationship can be represented using a reaction-time graph.
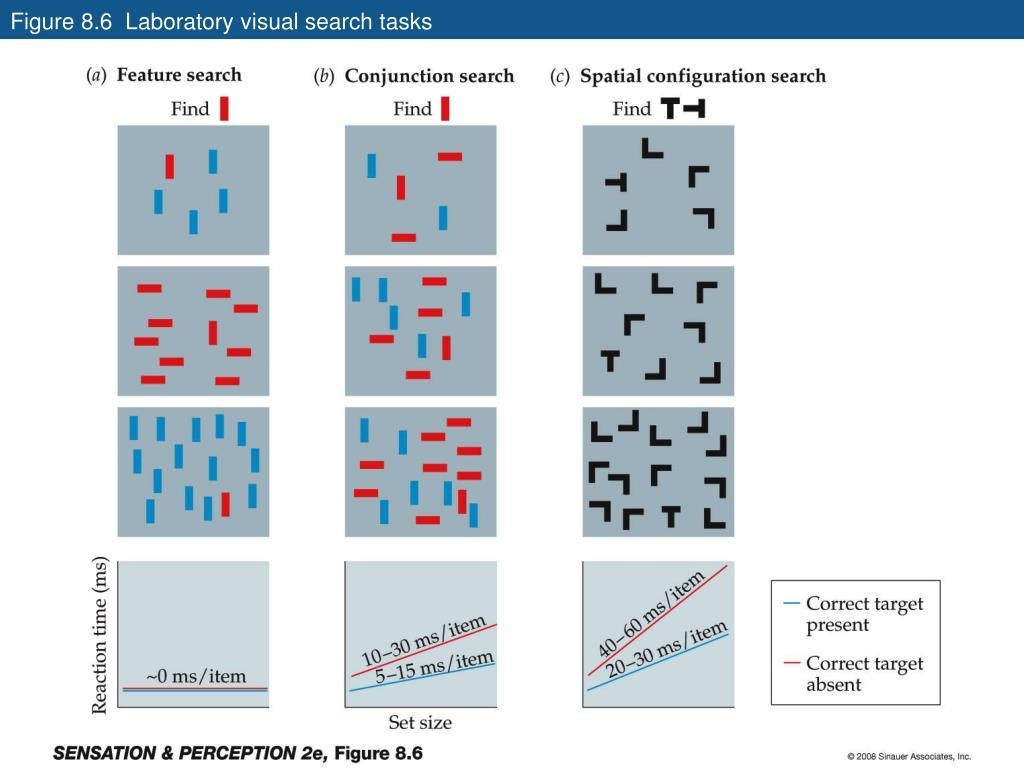
Expected relationship between visual-search set size and reaction time. Feature searches are predicted to show a shallower slope than conjunction searches.
The horizontal axis would represent the number of objects displayed, while the vertical axis would represent average reaction time in milliseconds.
Two separate lines would represent feature and conjunction searches.
3. Statistical testing
To determine whether the observed differences are meaningful, statistical tests can be applied.
A paired-samples t-test could compare participants’ average reaction times across two search conditions, provided the comparison is appropriately defined.
A repeated-measures ANOVA would be more useful for examining both search condition and set size together, including whether their effects interact.
The statistical analysis would help distinguish an observed difference from one that could plausibly arise through sampling variation.
However, statistical significance alone does not establish that a psychological theory is completely correct. Effect sizes, confidence intervals, accuracy, and experimental limitations should also be considered.
4. Comparing findings with Feature Integration Theory
The final stage would involve comparing the experimental findings with the predictions of Feature Integration Theory.
If conjunction searches produce greater reaction times and become progressively slower as set size increases, the findings would be consistent with an important prediction of the theory.
If feature searches remain relatively fast despite increasing set size, that would provide further support for the distinction between feature-based and conjunction-based visual search.
However, the results may not perfectly match the original research.
Participants might use different search strategies, certain visual features might be more distinctive than others, and online testing conditions might introduce additional variability.
These possibilities are not reasons to disregard unexpected findings.
In fact, they are important parts of scientific investigation.
Ethics and limitations
Because this project involves human participants, ethical considerations must be addressed before recruitment.
Participants should receive a clear explanation of the experiment, understand that participation is voluntary, and be able to withdraw. Since the proposed participants are high-school students, the study should first receive appropriate school and adult-supervisor approval, along with parental or guardian permission where required and the students’ own informed agreement.
No names, contact details, or unnecessary personal information should be collected. Data should be stored securely, and the experiment should avoid collecting information unrelated to the research question.
The proposed sample of 30–50 students could provide an initial exploratory dataset, but it should not automatically be considered representative of the wider population. Its adequacy would depend on the experimental design, expected effect size, and statistical power.
Beyond the experiment
What makes this project particularly interesting is that it connects several disciplines.
Psychology provides the theoretical foundation for understanding attention.
Psychophysics provides the experimental methods for measuring perception.
Computer science makes it possible to build interactive experiments and collect behavioural data.
Statistics allows us to interpret the results and evaluate whether our observations support the original hypothesis.
Together, these disciplines demonstrate how something as ordinary as finding an object in a crowded environment can become a measurable scientific problem.
The ultimate objective is not simply to prove that people can find certain shapes faster than others.
It is to investigate how the human visual system processes information, how attention influences perception, and how these processes can be studied using computational tools.
A browser can become more than a place to display information. It can become an experimental environment where human behaviour is measured, analysed, and interpreted.
And perhaps that is the most interesting part of psychophysics: the ability to turn something we experience every day into something we can scientifically investigate.
Resources & Further Reading
Foundational research
- Treisman, A. M. & Gelade, G. (1980). A Feature-Integration Theory of Attention.
The original research introducing Feature Integration Theory and its visual-search predictions.
https://doi.org/10.1016/0010-0285(80)90005-5 - The Gist of Anne Treisman’s Revolution.
A retrospective explanation of Treisman’s contribution to attention research and feature versus conjunction search.
https://doi.org/10.3758/s13414-019-01797-2
Experiment-building tools
- jsPsych — JavaScript Behavioural Experiments.
An open-source library for creating browser-based psychological experiments.
https://www.jspsych.org/ - jsPsych GitHub Repository.
Source code, examples, and development resources.
https://github.com/jspsych/jsPsych - PsychoPy.
An open-source Python environment for creating psychological experiments.
https://www.psychopy.org/ - Pavlovia.
A platform for hosting and running online behavioural experiments.
https://pavlovia.org/
Research methodology and statistical analysis
- Anwyl-Irvine et al. (2021). Realistic Precision and Accuracy of Online Experiment Platforms, Web Browsers, and Devices.
An important investigation into the reliability of online reaction-time experiments.
https://doi.org/10.3758/s13428-020-01501-5 - SciPy Documentation.
Statistical tests and scientific computing tools for Python.
https://docs.scipy.org/doc/scipy/ - Pandas Documentation.
Tools for organising, cleaning, and analysing experimental datasets.
https://pandas.pydata.org/docs/ - Matplotlib Documentation.
Tools for visualising reaction times and experimental results.
https://matplotlib.org/stable/
Suggested research extensions
- Investigate whether target-present and target-absent trials produce different reaction-time patterns.
- Compare the effects of different set sizes on feature and conjunction searches.
- Explore whether stimulus density or distractor similarity influences visual-search efficiency.
- Compare results from different browser-based experiment environments.
- Investigate individual differences in visual-search performance without treating reaction time as a measure of intelligence or overall cognitive ability.